


Would you like to start a conversation with other industry leaders to brainstorm a challenge or to just know more on a particular topic?
Engage in online discussions with your Peers
Start Now
Most organizations globally face pressures to gain and retain competitive advantage by identifying cost cutting opportunities, improving quality, reducing turnaround time and enhancing customer experience. Essentially every one of these is a process management or an improvement technique. The better we manage our processes, the better our chances of taking advantage of efficiencies – and improve effectiveness. On the other hand, many organizations do not have full understanding of how process steps affect quality of the output. The first step is usually the realization that processes can be and need to be optimized to yield even better outcomes. If there is no objective basis for judging the quality of processes, the products or services from those processes may not solve the problems that they are supposed to.
In an effort to ensure that processes are consistently managed, controlled, and reported across an enterprise, many organizations use a business process management (BPM) maturity model - a structure of capabilities with various levels of specified ‘maturities’ like the six phases of Gartner BPM model.
Over the years, few more process management models have been developed to assist the organizations make such assessments. These BPM models are at the ‘organizational level’ and are not at the mega process or major process levels within an organization. The Gartner model assessment clearly indicates that many organizations are in the early stages or phases of BPM, thereby confirming the need for organizations to step up their focus on the critical success factors for holistic BPM maturity. With the advent of off shoring, global in-house (captive) centers and major BPOs have become essentially process management centers by design to drive performance and value.
…being a large industry encompassing multiple domains and a range of processes, the model focuses on six primary and most important parameters common to all services…. a 6 x 5 Matrix to assess the major or mega processes for the organization...
There are a few process maturity models that are in vogue today. Having said, they draw upon the organizational model of Gartner then construct an approach based on real life experience of processes with key parameters that directly affect the output and outcome from such processes. Hence, one can say that a clear need exists for the Business Services industry to have an implementable model that can help to assess and classify the levels of maturity of the ‘processes’ per se at the mega or major process level, before deploying a model to assess and categorize their process ‘management’ maturity at the organizational level. Accordingly, Shared Services Forum as a community of practitioners and industry experts, decided to evolve a Process Maturity Model (PMM) that is based on industry practices.
This PMM can be used as an evaluation tool to benchmark processes in the GICs or BPOs or India shared service centers, against a standard set of parameters to assign levels of process maturity. The intention of setting up such a model is to create a methodology which can be used to measure improvements as well as establish thresholds.
An organization with mature processes effectively defines, manages, measures, and hence, has greater scope or opportunities to improve its processes. Processes are documented, roles and responsibilities are well understood, and work flows are easily updated when necessary. A disciplined process is consistently followed because all participants understand its value, and infrastructure is readily created to support it.
Process Maturity Model developed by SSF
The model developed at SSF is primarily designed keeping in mind the extent of detail required/ available in the Business Services industry. Business Services, being a large industry encompassing multiple domains and a range of processes, the model focuses on six primary and most important parameters common to all services. This model uses a 6 x 5 Matrix to assess the major or mega processes for the organization and classify them into five levels – Levels 1 through 5).
Eventually, the model will enable a function or an organization to ‘move up the value delivery’ to customers and stakeholders. It is essential to emphasize that the PMM of SSF can be well applied to all processes within enterprise functions (like F&A, HR, SCM, IT, CLM etc.,) in various sectors and industries, as this will reinforce the need to focus on processes by all companies across all major industries.
The summary structure (Parameters & Levels) of the PMM is given below:
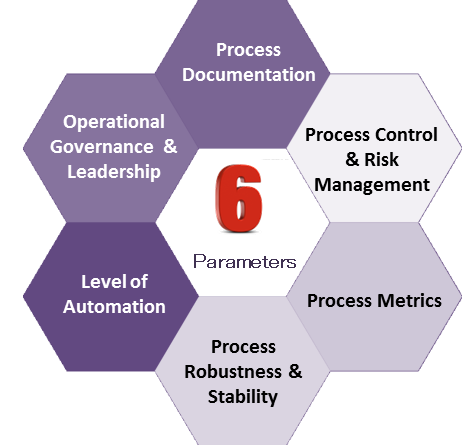
The Parameters of PMM
There are six most important parameters for process maturity assessment and these have been reviewed and revised based on real life application and assessment. Given below are the descriptions for each of the parameters and the drilldown of the details for the various levels for each parameter to enable an objective assessment, and keep it meaningful and even convincing to the leaders of the organization.
A- Process Documentation
Process documentation is a complete written description of how to execute a given process. This includes any and all documents that go to support a process – process execution maps, policies, checklists, tutorials, forms and links to other applications and processes. The intention of creating such documentation is to:
- have a common view of the steps in a process
- reduce vulnerability to employee specific knowledge
- improve processes
- create a training plan
Process documentation is segregated to include all necessary information on the inputs and the desired outputs as well, through a SIPOC and deployment charts to share how the process ‘flows’ across the organization through multiple departments as well as in multiple forms (manual/ scanned/ automated etc.).
B- Process Control & Risk Management
Process control is the starting point to assess potential process risks (what can go wrong) including exceptions, failures and outages handling. Risk management is the complementary process of identifying and evaluating a threat to the outcome of a process or to the enterprise as a whole as a result of an error in execution of a process. The risk involved could be as simple as cost of re-work or loss of actual or expected revenue. It could even be the more serious threats such as poor customer experience, loss of reputation or compliance failures.
Usually companies deploy several methodologies like FMEA to capture the control issues, classified according to occurrence, detection and prevention to predict such incidents of losses and put in place processes to prevent, measure, report, evaluate and fix them.
C- Process Metrics
Process metrics are numeric measurements used to evaluate and benchmark business processes performance. Metrics tell the process owner how the process is operating.
Process metrics can be of several types – input, process, output, or outcome. Besides, the metrics dashboard, visible numerical values of process performance will help to drive the process maturity. Similarly, metrics on real time and historical basis will add how the process is performing over a period of time. Each of these measures the process from different perspectives. Several combinations can be made to these metrics to determine process efficiency, effectiveness and flexibility. Efficiency determines the relationship between input and output while effectiveness measures the quality of the outcome. Flexibility metrics, on the other hand, determine the ability of the process to handle exceptions and adaptability to changes.
The outcome metrics can also be linked to business metrics and KPIs to assess how well the process is focused on business performance and not just on process operations.
D- Process Robustness & Stability
Process robustness reduces, minimizes and eliminates the variability in output and outcome. Process stability refers to the ability of the process to consistently provide the same desired result each time it is executed. If the process is executed by the same operator repeatedly the results returned should be well within the acceptable desired range – this is called process repeatability. In case the exact same process is executed by other operators, the results retuned here too should be well within the acceptable desired range – this is called process reproducibility. The combination is referred to as R&R – Repeatability & Reproducibility for process maturity assessments.
The acceptable range itself should be set as narrow or broad as required by the process owner. In a stable process, both the Lower Control Limit (LCL) as well as the Upper Control Limit (UCL) should be well known and on a narrow band.
E- Level of Automation
Of late this parameter has begun to take greater significance in assessing maturity level of processes since it provides a good opportunity to ensure the adherence to all the four parameters discussed above. This includes use of control systems, bolt on tools for operating processes with minimal human intervention, effective utilization of ERP etc., In fact, this is a key driver for process capability base-lining as well as productivity measurements. In cases of high levels of process automation, variability of process execution would be low, controls and risk management process would be strong, predetermined metrics would be easily available, and the process outputs are likely to be very stable.
However, there are many other factors too which make this parameter important. It ensures a direct linkage to the other enterprise processes by using a common platform. Use of state–of-the-art applications can also better prepare the organization for the unknown vagaries of the future.
F- Operational Governance & Leadership
This parameter measures the engagement levels of the leaders and the effectiveness of structured governance of the process performance. It determines the extent control the leaders have on the processes, as opposed to the processes being completely ad hoc and arbitrary. This will extend to how the leaders across levels are managing the process through team meetings, reviews, visuals, assigning tasks including peaks/ troughs, inviting comments and suggestion for team engagement. It also measures process ownership and importance of shared responsibility amongst the teams. This can be used as an effective tool to improve efficiency and effectiveness metrics, as well as act as an innovation and experimentation lab for the future.
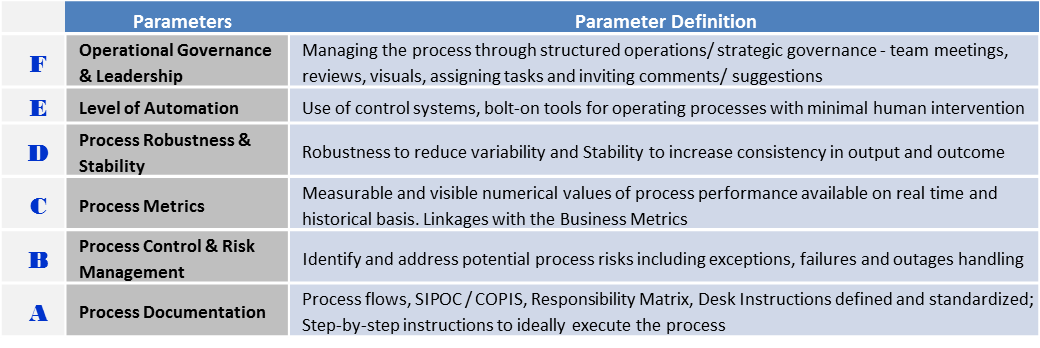
The chart below summarizes the description for all six parameters.
The Levels
The Level is the final measure for each parameter as well as for each process. In a way, this becomes the output of the model at various stages: i) Each Major process ((Payroll, Accounting, Accounts Payable etc.,), ii) Each Mega Process or Function (Finance, HR, IT, SCM) and finally iii) organization as a whole for Multiple Functions - by aggregating the assessments. The level also clarifies or reinforces the cross section of assessment between parameters and the current state.
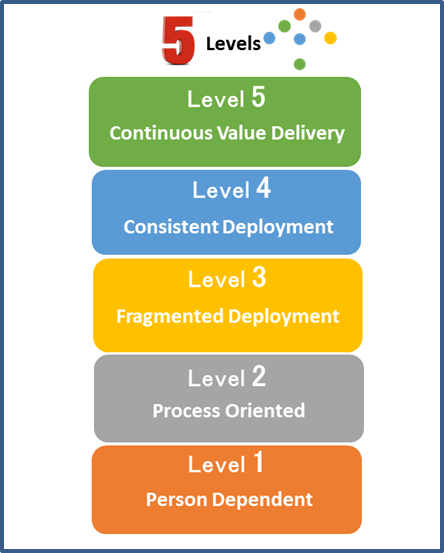
Level 1 - Person Dependent
This level represents the most basic or ad hoc processes. At this level success often depends upon the limited understanding or whims of the employees in the organization. The process flows and risks lies in peoples’minds. The process does not even have proper documentation and depends upon the instincts of the individuals. Even the leaders may follow an instructional way of managing the process or have personal preferences to drive the process. At this level, services may just happen, but often exceed timelines and may involve huge re-work. Both repeatability as well as reproducibility are often a challenge.
Level 2 - Process Oriented
At this level services are planned, performed, measured, and controlled. Limited technology is used. However process and procedures may vary between units, departments or even teams. Requirements, processes, work products, and services are managed with specified delivery points in mind. Processes are reviewed and revised as needed, and they are reviewed and controlled to meet requirements, standards, and objectives. Generally, processes are not extended beyond a department or business unit, and there is often little or no executive support.
The Level 2 itself is a big jump and it is important to refer to the specifics for this level to decide the right level and not go by gut-based comparative performance between the past and current. This level is set against benchmarks and not against past performance.
Level 3 - Fragmented Deployment
At this level processes are deployed universally, though are fragmented. The focus at this level is ’deployment’ i.e. process flow across functions/ departments. Interlinking of process is weak though processes are defined, understood, and documented. Standards and tasks stem from departmental output requirements and are performed consistently across the organization. Variations are allowed per established guidelines.
Processes are qualitatively predictable, but generally there are no measurements to enforce or improve it. Use of technology and automation is limited to stand alone, usually desktop level applications.
Level 4 - Consistent Deployment
At maturity Level 4, tasks or sub-processes contribute to overall performance, and they are controlled using statistical and other quantitative techniques. Measures are established for quality and performance, and they are used as criteria for managing processes throughout its entire lifecycle. Process variations are identified and corrected, and performance is both controlled and predictable. Error correction methodologies are traced to source and teams authorized to fix fundamental issues even if they happen to be in areas outside the control of the processors. Needs of the customer drive the process with clear linkage between process outputs and business outcomes.
Processes are implemented in an effort to support business decision making. Technology usage is core and applications are part of enterprise wide resource management systems.
Level 5 - Continuous Value Delivery
At this highest maturity level, processes are continually improved based on quantitative analysis of common causes of variation. The focus is on continually improving performance through both incremental and innovative technological improvements. Quantitative process improvement objectives are established, revised, and used to manage process improvement. Improvements are evaluated against organizational objectives, and an empowered workforce executes them. Such objectives are usually governed by customer experience management techniques.
The organization rapidly responds to changes and opportunities, and it openly shares learning and knowledge. Deployment of robotics for repetitive tasks and that of artificial intelligence for cognitive tasks is common and encouraged.
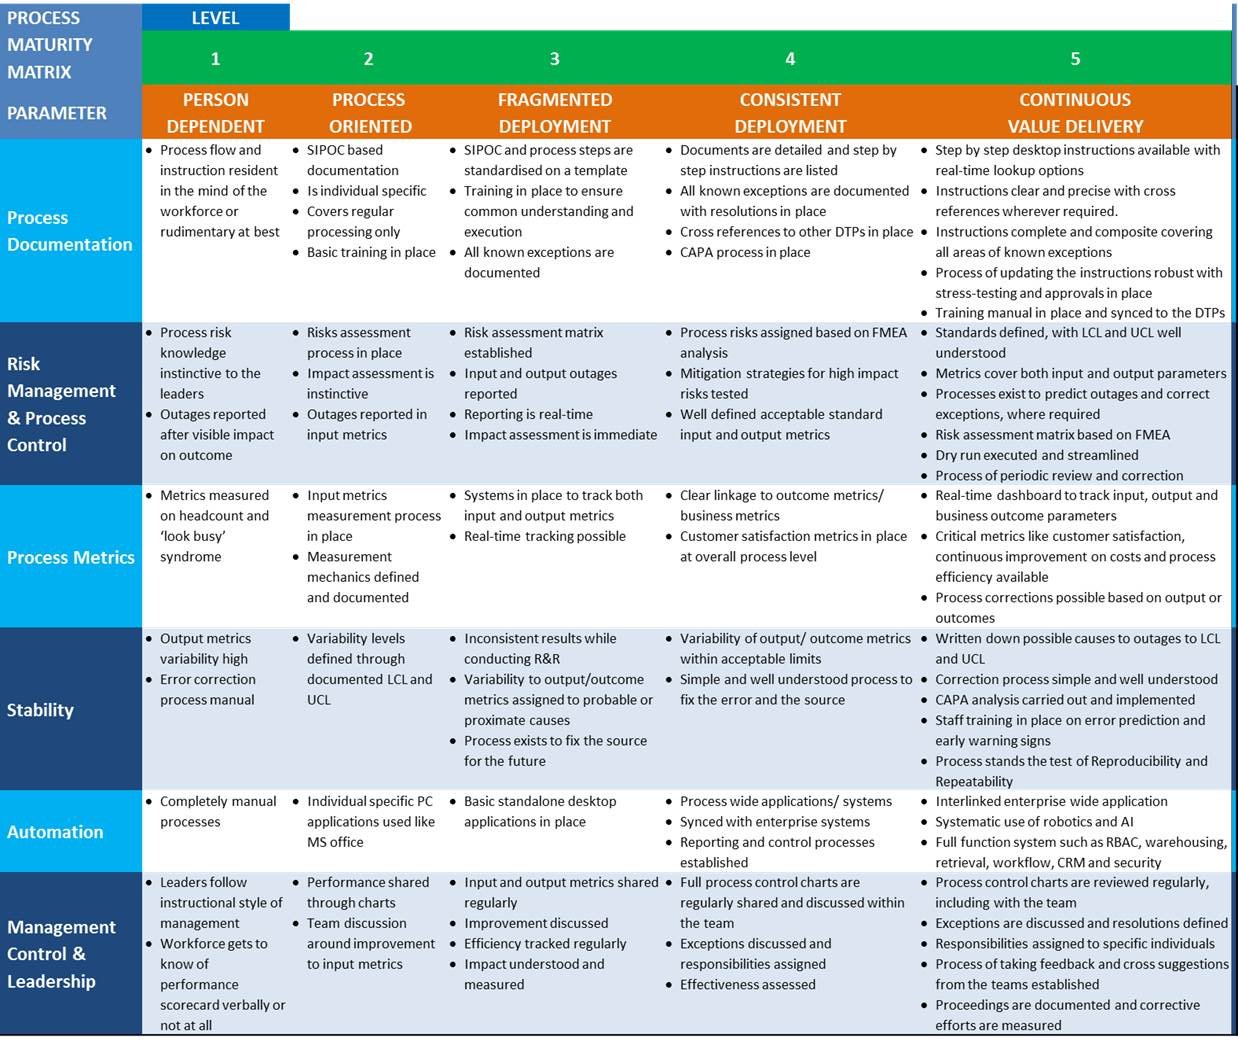
The Detailed Structure of PMM
Using the combination of the six assessment parameters and the five levels, the model creates a matrix to establish process maturity. This model can be put to use on any process of business services industry or enterprise function. Each parameter can be assessed individually and therefore each can well be at different levels of maturity. The process can then be assessed as a whole to arrive at a common maturity level. Since every parameter is generically connected with every other, it is highly unlikely that the parameters would in themselves be at vastly different levels of maturity..
The basic structure of the model is given below:
Deployment of the Model
The Process Maturity Model of SSF has been deployed in several overseas and Indian environments as well as GIC and India SSC situations. It has provided great results in these multiple scenarios and hence, has successfully passed the test of deployment.
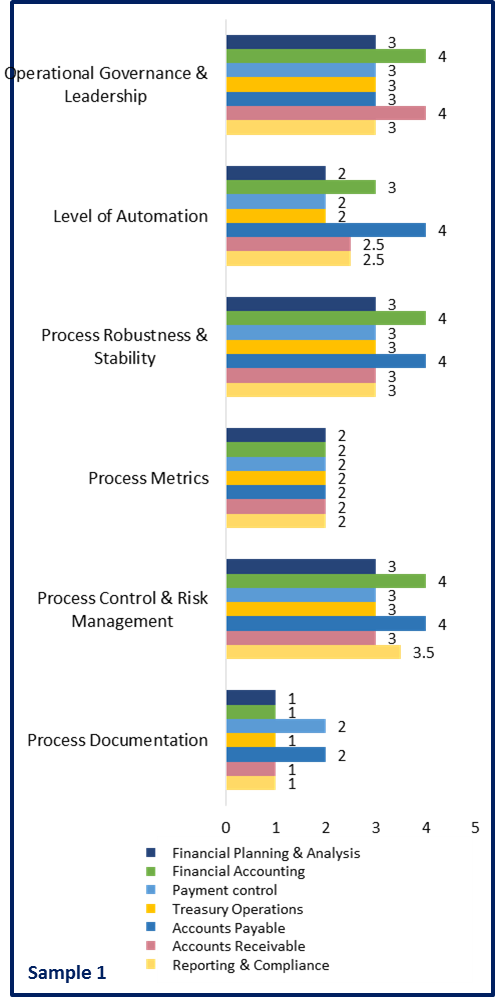
Sample 1 illustrates PMM assessment for a services organization depicting the process maturity levels of its finance function - that has 7 major processes.
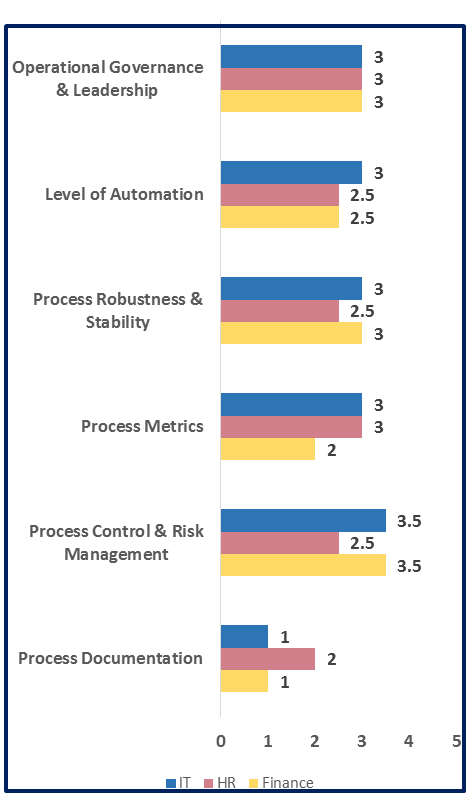
Sample 2 illustrates the consolidated PMM assessment for the organization depicting three functions - Finance, HR and IT of which the Finance function is a consolidated view of Sample 1
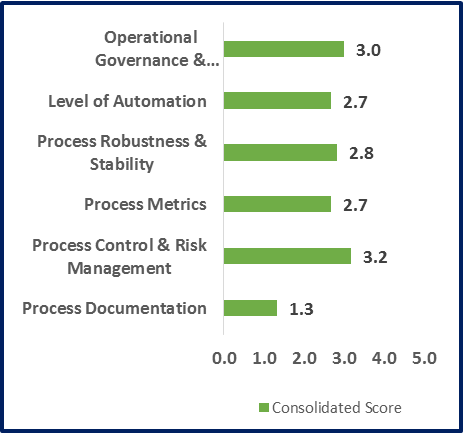
Sample 3 illustrates the consolidated PMM assessment for the organization on the six parameters for the 3 mega processes in scope (as in Sample 2 – Finance, HR and IT). This view gives an overall summary of the observations guiding the assessment and also the priority wise actions to move up the value delivery
Benefits to Corporates
Organizations stand to benefit greatly by undertaking this journey of process maturity assessment. Some of the possible benefits are:
1-Performance measurement – outcome impact. Very often companies go through a series of processes without having a clear sense on how the processes impact the real business of the company. The PMM assessment assurance is a methodology that helps the company trace a direct linkage between the process and the business of the company. This act by itself is first step to gauge the relative importance of the process in the functioning of the company.
2-Process improvement. As processes go through the various levels of PMM, there is an automatic affinity to continuously improve performance to reach optimum levels of efficiency.
3-Benchmarking. Comparison is possible between different processes of the same or organization or between organizations by bringing them to a common level of understanding and assessment.
4-Consistency. This ensures that the desired results are achieved for each instance after the other with all exceptions built in, even after they have been repeated or reproduced. Consistency is not automatic. It needs robust processes controls to exist. PMM recognizes such processes and assures consistency.
5-Customer service. Great performance need to mean great customer satisfaction. Whether or not customer satisfaction is a defined SLA of a process, PMM forces the focus on it. PMM places a high degree of importance on this ultimate acid-test of service.
6-Risk. Assessing the extent of exposure and readiness with mitigation strategies could well be the key difference between a well thought out processes and a poorly designed one.
7-Cost. Each process control comes at a cost. This parameter counter balances the relative benefits of tightening controls and other value added processes.
8-Employee engagement. Organizations cannot work in silos or in isolation. The workforce is an equal stakeholder in the success or otherwise of its processes. Employees with higher levels of engagements with visibility on how their efforts impact the ultimate business goals tend to do well for themselves and the company. PMM helps leaders keep a keen eye on how to do just that.
9-Evaluate capabilities of suppliers. Often the quality of output is determined by the quality of input. PMM can be used as a measurement tool to assess and document quality of the input data – whether from an internal source or external.
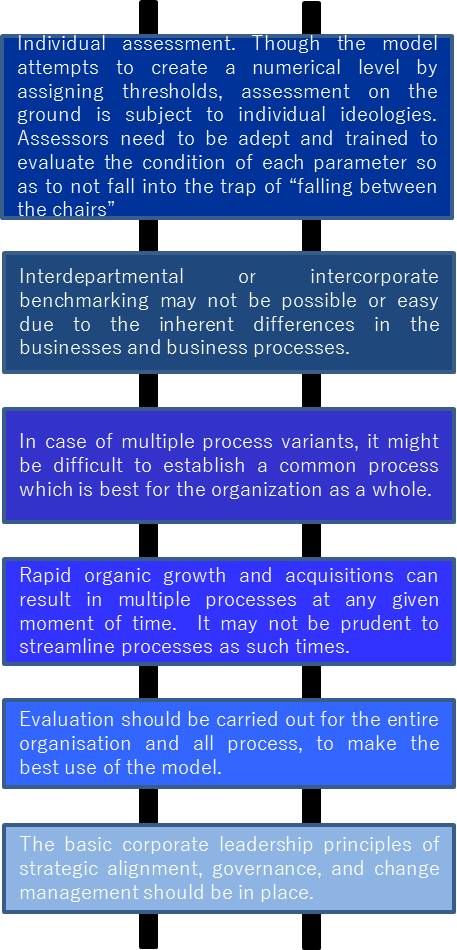
Challenges & Requirements
As in all assessment tools, this model has to be watched out for a few specific requirements. Not all of them need be a challenge for all....
Conclusion
SSF’s Process Maturity Model is designed to support the services industry and enterprise functions of all industries to better understand the individual elements that helps achieve a more rigorous, structured, and controlled process program. In addition it creates a focus on high-risk or large impending change. Additionally, organizations are likely to have visibility into improvement initiatives to avoid conflicts, define common improvement approaches, and to identify and recommend improvements.
In the cut-throat world of business today, following a defined and structured model as the PMM could well be the competitive advantage for the company.
ABOUT THE AUTHOR

Sanjay Gupta
Chief Architect – Shared Services Forum
Sanjay Gupta is the Chief Architect of Shared Services Forum (SSF). He has 33 years of work experience in the fields of Management, Business Process, Finance & Human Resources. He is a Chartered Accountant and comes with a blend of experience in global and domestic corporations, in private sector and public sector organizations in various capacities. He combines extensive experience in strategic as well as operations roles, covering various domains in Off shoring, Financial Services, Insurance in Global Shared Services & BPO, with demonstrated execution and success. He initially worked within the core Finance & Accounting functions in domestic companies such as Living Media and Indian Oil Corporation, and moved to American Express FRC where he first migrated and then serviced several groups of international financial services covering card and travel business. Later at EXL Service Holdings, he was instrumental in growing the BPO Business and Operations across multiple verticals, leading several business process initiatives, and developing frameworks connecting operational service delivery to business KPIs of clients. Having led large teams and given his focus on people and performance, Sanjay moved to become the Global HR Head for EXL.